
You did all the work of preparing for the ACT, you sat through the 3+ hour long test, and now you’ve got your ACT score report in hand.
There are a lot of charts and graphs and numbers. What do they all mean?
Let’s go through each part of the ACT score report and talk about how to interpret your ACT scores.
How’d you do?
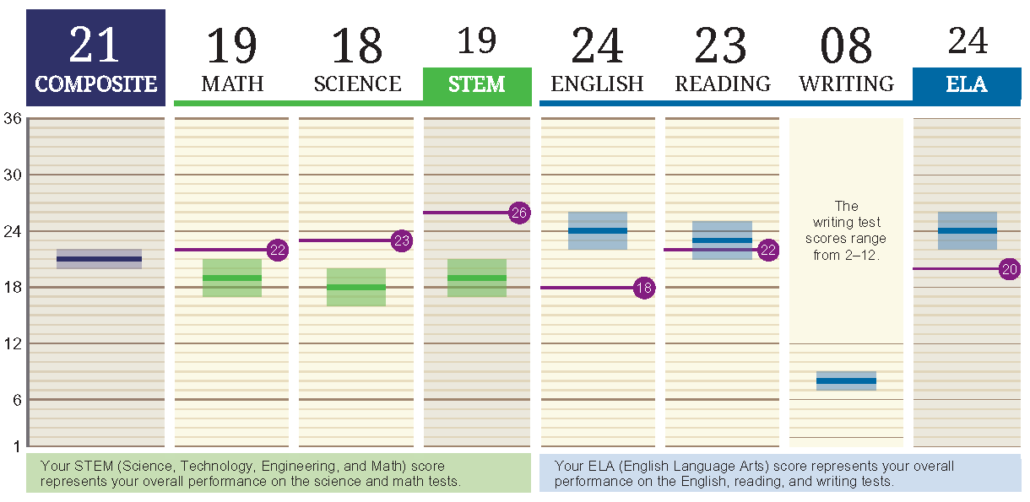
The first thing you’ll see on your ACT score report is a chart with your composite score and section scores. It’ll look like this:
Source: ACT, Inc.
Let’s go through the scores shown in this chart.
- Composite score: This is the biggie—your overall ACT score. When someone asks, Hey, how’d you do on the ACT?, this is the score they’re referring to. The composite score is the average of your four main section scores (math, science, English, and reading). Keep reading to find out whether your composite ACT score is good.
- Math: This is how you did on the math section, out of a possible 36 points.
- Science: This is how you did on the science section, out of a possible 36 points.
- STEM: This is the average of your math and science section scores.
- English: This is how you did on the English section, out of a possible 36 points. (Seeing a pattern?)
- Reading: This is how you did on the Reading section, out of a possible 63 points. (Not a typo—just checking to see if you’re still paying attention! It’s out of 36 points.)
- Writing: If you took the essay section, this is your essay score. Just to shake things up, the Writing score is given out of a possible 12 points.
- ELA: You’ll only get an ELA score if you took the Writing Test. Your ELA score is a weighted composite (since you can’t average three scores that aren’t on the same scale) of your English, Reading, and Writing scores.
So what’s with the lines and bands in the chart?
- The purple lines show the ACT College Readiness Benchmarks in each section. ACT has conducted research to estimate the scores at which students are most likely to succeed in college courses. So, in the example above, this student scored just a bit higher than the College Readiness Benchmark for Reading. According to the ACT, she has about a 50% chance of getting a B or higher and a 75% chance of getting a C or higher in a freshman college course that focuses on reading.
- The green (for STEM subjects) and blue (for ELA subjects) lines are your score.
The bands around your score lines show a score range. This is the range in which you would be expected to score if you took the ACT again tomorrow—it accounts for slight fluctuations in test performance.
What’s a good ACT score?
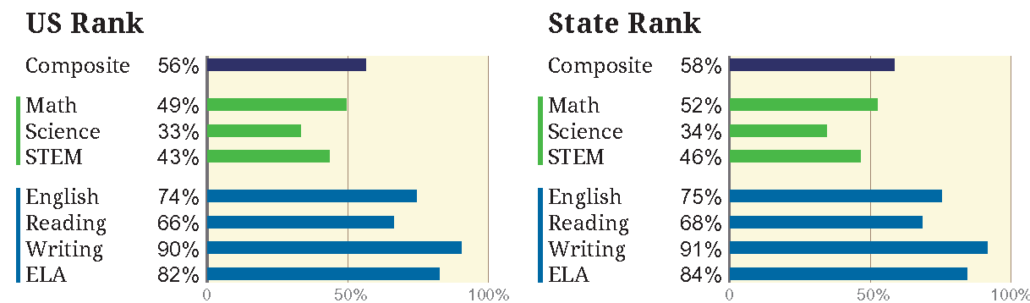
There are two lenses through which you can view your ACT score. This first is to compare your score to the scores of other test-takers. Lucky for you, your score report does this for you:
Source: ACT, Inc.
Your ranks show how you performed compared to recent high school graduates who took the ACT. This particular student scored the same or better than 56% of recent U.S. graduates who took the ACT. She scored the same or better than 58% of students in her state who took the ACT.
Knowing how you did compared to other students can give you context on your performance, but it won’t tell you how much your score will help you in achieving your college goals. For most students, the better lens to use in examining ACT performance is to compare your scores to the middle 50% of scores for your goal colleges.
Let’s take a closer look.
Scenario 1: I want to go to Cornell.
The middle 50% of students who enrolled as freshmen in 2023 scored between 33 and 35.
This student’s ACT score of 21 isn’t going to cut it, so based on this goal, her ACT score is not good.
The verdict: This score is not good.
Scenario 2: I want to go to SUNY Oneonta.
The middle 50% of students who enrolled as freshmen in 2023 scored between 23 and 28.
This student’s ACT score of 21 is okay. A bump would help, but a lot of students with this score are accepted at this school.
The verdict: This score is okay.
Scenario 3: I want to go to Rutgers Camden.
The middle 50% of students who enrolled as freshmen in 2023 scored between 18 and 26.
This student’s ACT score of 21 is well within range, so although the student could improve her chances of admission with a score boost, her score is perfectly in line with the school’s averages.
The verdict: This score is good.
How can I figure out what to study to boost my ACT scores?
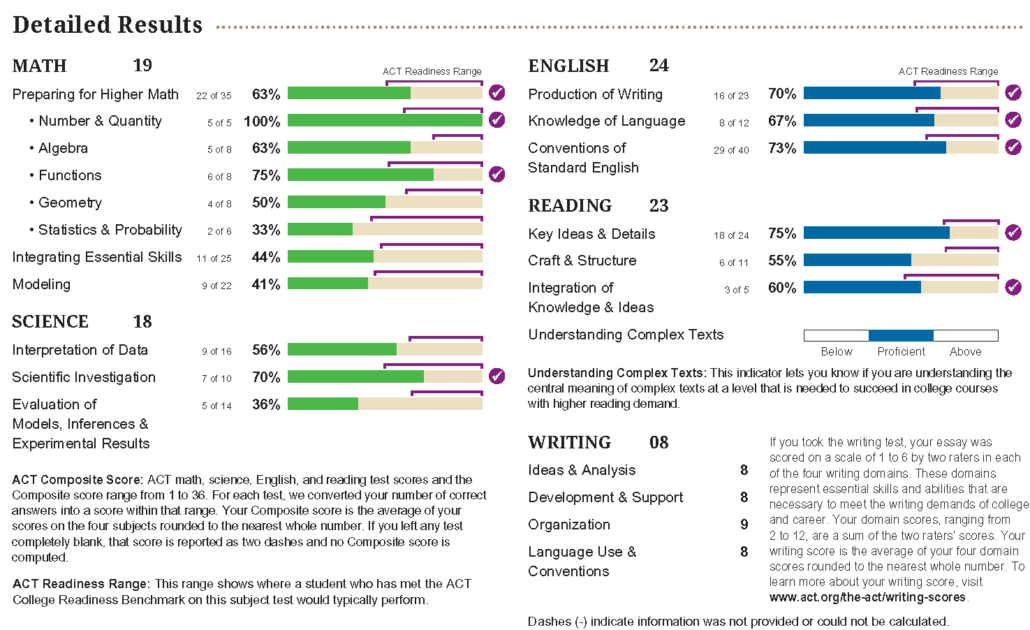
The next section on your score report offers detailed results:
Source: ACT, Inc.
This breaks your performance down by topic or question type, which can help you decide which areas you need to focus on the most during your ACT prep sessions. Here are some things to pay attention to:
- Raw count versus percentage: It’s tempting to just look at the bar graphs that show you the percentage of each question type that you answered correctly. For instance, in math, that 22% on Statistics and Probability looks pretty bad—clearly, you’d want to spend a lot of time on that topic, right? Not necessarily. If you look at the question counts, the student only missed 4 questions on that topic. But it you look at Integrating Essential Skills, where the student answered 44% of questions correctly, she missed 14 questions, which would have had a much bigger score impact.
- Topics or skills that are connected: Especially on the math side of things, some skills are linked to one another. For example, Integrating Essential Skills questions address concepts typically learned in middle school. These topics often influence a student’s understanding of later concepts in algebra or geometry. In other words, by boosting understanding in Integrating Essential Skills, you might be able to improve performance in other math areas.
Ready to start your ACT prep? Check out these posts for help:
- How to Get a 30 (or Higher!) on the ACT: Key Study Tips
- ACT Study Guide—A Simple Step-by-Step Approach
- 7 ACT Time Management Tips
What else will my ACT score report tell me?
The ACT score report offers a bunch of additional information beyond your scores:
- The colleges you selected to receive free score reports
- Career and major guidance based on the interest inventory offered before the ACT
- A prediction of how you would score on the ACT WorkKeys assessments, which are used to qualify for the ACT National Career Readiness Certificate, a certificate that can help students entering the job market directly after high school
Stats on retesting with the ACT (fun fact: more than half of students see score increases if they take the test again).
If your still can’t make heads or tails out of your ACT score report, don’t worry! We’ll be happy to go through it with you. Find your local C2 Education center, and schedule a free consultation.